


 By: Admin
How Do I Investigate My RISA-3D Model Using the Deflected Shape?
When your RISA-3D model is not behaving as you anticipated, one of the...
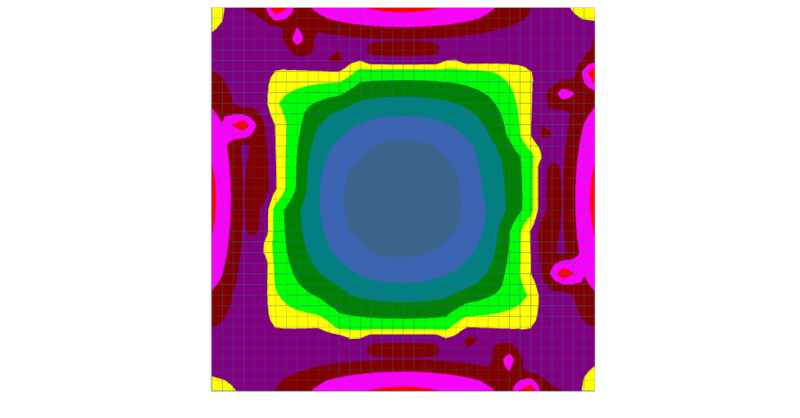
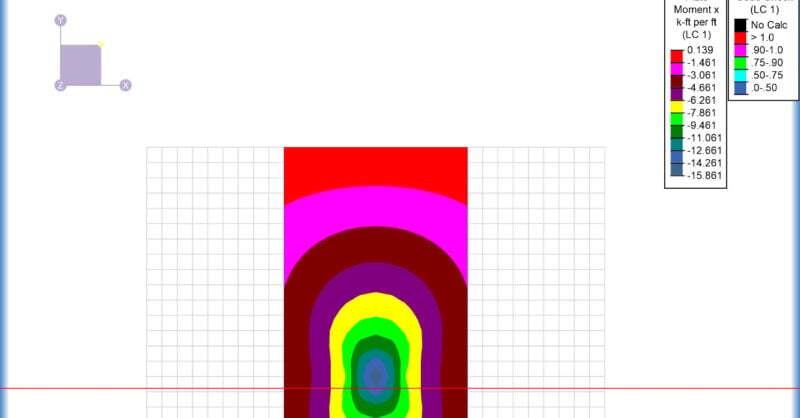
After solution in RISA-3D, you can use Results View Settings to view the Plate Contours graphically on your model.
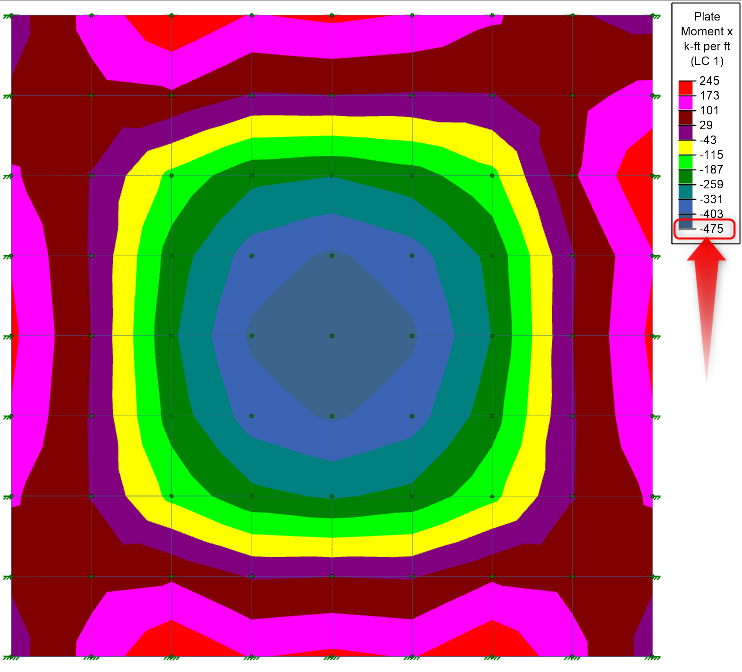
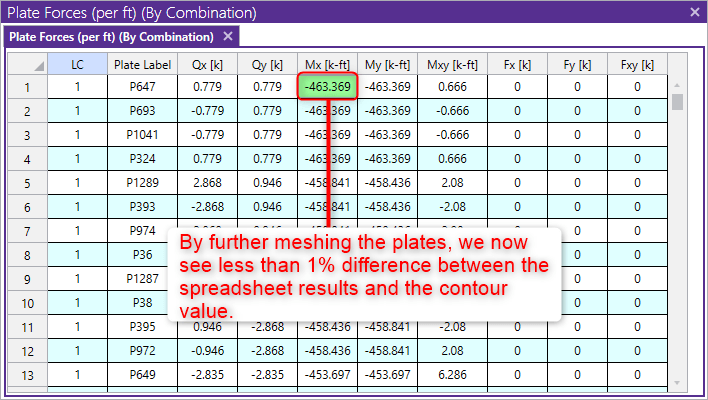
Many times, these contour values will not exactly match the values reported in the Plate Forces/Stresses spreadsheets.
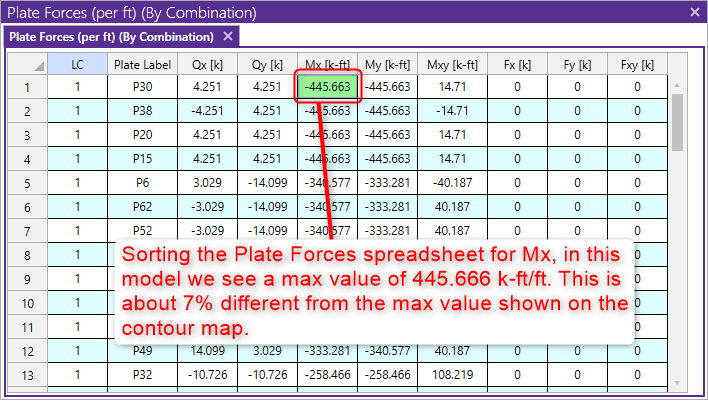
The spreadsheet value is the true analysis value, taken at the center of each plate. The contour maps are created using a smoothing algorithm that connects the spreadsheet value with the values of the plates around it to create the contour. This smoothing feature can lead to the difference in values between the contours and the spreadsheet.
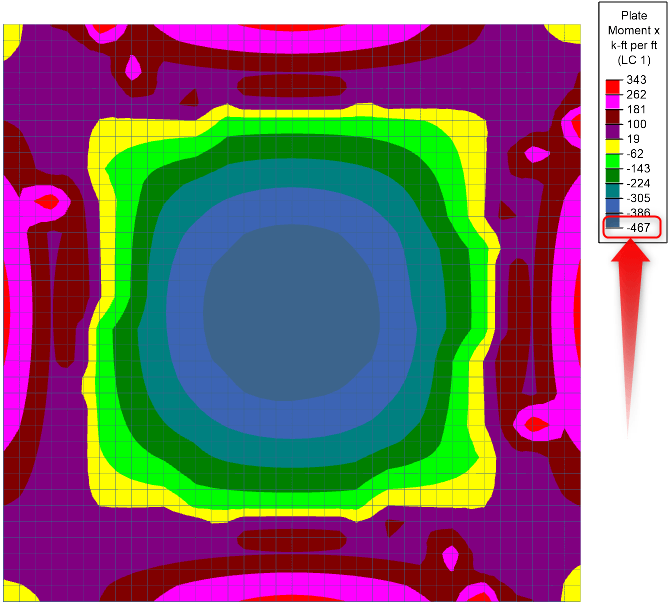
You can increase the accuracy of your contours by meshing your plates into smaller plates. For design purposes though, we still recommend using the spreadsheet values as these will be the most accurate values.
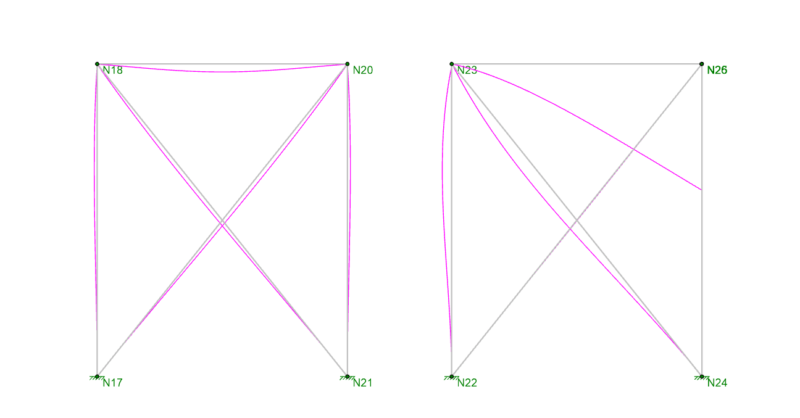
When your RISA-3D model is not behaving as you anticipated, one of the...
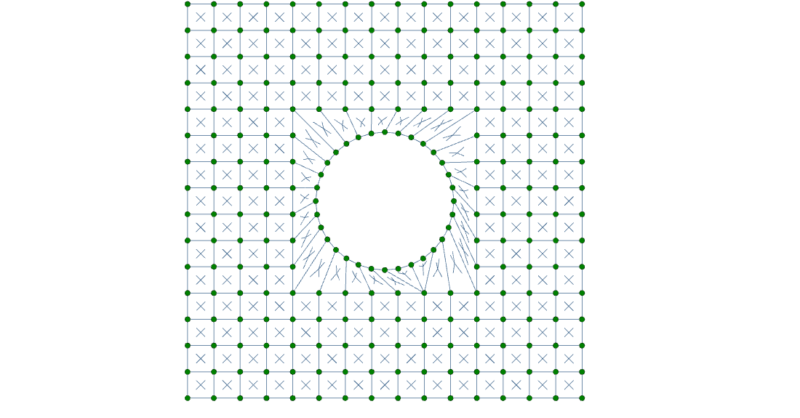
While RISA-3D (or RISA-2D) does not have an explicit tool to punch a...
When you have a plate model for a slab or wall in RISA-3D, the...