Concrete Design per ACI 318-14 Concrete Code now Available
The new ACI 318-14 code has been implemented into RISA-3D v14,...
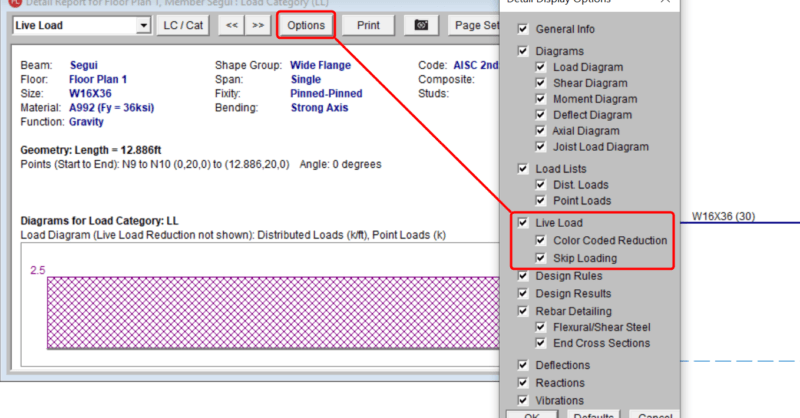
The consideration of Live Load reduction is a feature that has been in RISAFloor from the very beginning. However, recent changes to the interface make it significantly easier for you to understand how live load reduction is affecting the design forces in your structure.
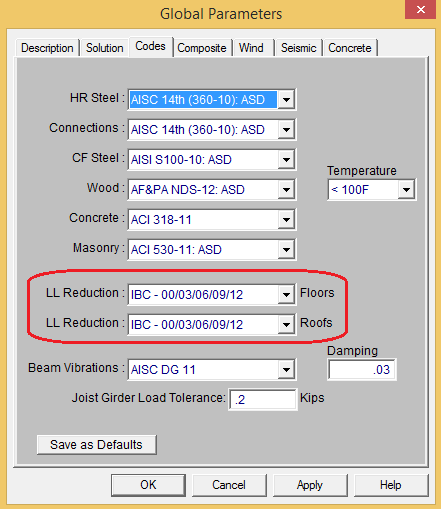
As always, you may choose which code you want to use for Live Load Reduction based on the settings on the Codes tab of the (Global) Model Settings shown above.
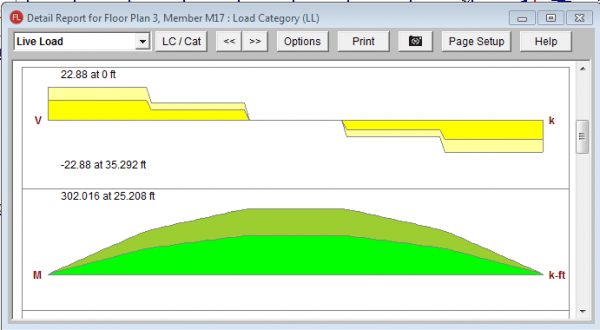
New to RISAFloor v10.0.1 are better graphics in the member detail report diagrams that make it clear how much of an effect Live Load Reduction has on that specific member.
The force and moment diagrams are now color coded in a way that makes it clear how significant the consideration of Live Load Reduction will be at any point along the height of the column or along the length of the member.
When viewing a column or beam details report, the axial force, shear and moment diagrams consider the effects of live load reduction based on the Detail Display Options. Lighter colors in the diagram indicate the portion of the display load that got reduced.
The maximum and minimum values reported with the diagrams will change based on the Live Load Reduction checkbox shown above. Similarly, the color coding may be turned off by un-checking the Color Coded box.
Also new to RISAFloor v10.0.1 is the consideration of live loads in the RISA-3D solution. This is only done for combined RISAFloor / RISA-3D models.
One of the reasons why it is easier for a program like RISAFloor to perform Live Load Reduction is because the analysis results are based on category solutions. At any point in a column or beam, it is know exactly how much of the result is due to Live Load, or Roof Live Load or such. As such, the Live Load results are specifically known at all locations.
However, programs like RISA-3D need to be based on Load Combination solutions if they are to properly account for non-linear effects (P-Delta , compression only springs, et cetera). Therefore, it is not possible for RISA-3D to know precisely how much of a given result is due to Live Load.
When the two programs are used together, RISA-3D uses the existing RISAFloor results and the RISA-3D Load Combination information (categories and load factors) to estimate how much of a given RISA-3D result was to each specific type of live load.
This does not affect the RISA-3D analysis results themselves (member forces, joint reactions, etc), but is only considered during the RISA-3D code check routines. That way, the analysis results in RISA-3D are still accounting for the non-linear effects of the overall load combination, but the design results / code checks can still reduce those values based on the RISAFloor category results.
You can easily control the LL reduction in RISA-3D separately in the on the Codes tab of the (Global) Model Settings in RISA-3D.
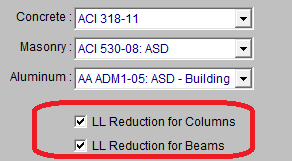
RISA-3D has interactive / expandable force diagrams. This can be used in conjunction with the LL Reduction checkboxes to see exactly what effect Live Load Reduction has at any spot along the length of a member.
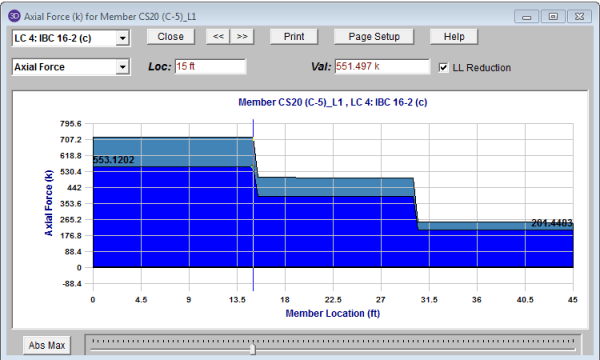
In the diagram above it is easier to see that the percentage of live load reduced for the column goes up as the tributary area of the column increases towards the base of the column.
Also, new to RISAFloor v10.0.1 and RISAFoundation v8.0.1 is the consideration of Live Load Reduction for RISAFloor columns.
The same basic methodology described above for RISA-3D is used to transfer loads into RISAFoundation. The main difference is that this reduces the actual RISAFoundation loads included in the analysis whereas in RISA-3D the only effect is on the member code checks.
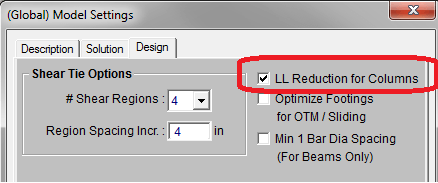
The consideration of live load reduction can also be turned off in RISAFoundation by unchecking the checkbox on the design tab of the (Global) Model Settings.


The new ACI 318-14 code has been implemented into RISA-3D v14,...
The new TMS 402-16 Masonry Code (formerly designated as ACI 530 and...
The CSA A23.3-14 code has been implemented in RISA-3D v15.0, RISAFloor...