RISA-3D
RISAFloor
RISAFoundation
RISAConnection
RISA-2D
RISASection
RISACalc
ADAPT-Builder
ADAPT-PT/RC
ADAPT-Felt
Link Utilities
All Products
For Students
For Instructors
Try the Complete RISA Suite for 10 Days FREE
Educational Licenses
Webinars
Reach an Engineer
Tips & Tricks
Design Codes
Case Studies
New Features
Cloud Licensing
Training Courses
Video Library
Downloads
Licensing Support
Customer Portal
Product Documentation
System Requirements
Specifications
Online Help
Get Support
Contact
Careers
Employee Spotlight
Nemetschek
License Agreement
Privacy Policy
Open BIM
Partners
About Us
August 21, 2019
By: Admin
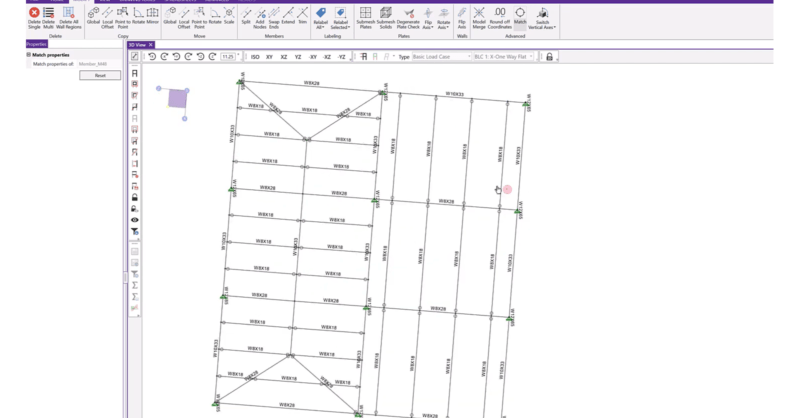
RISA-3D now includes the ability to "match properties" between...


 By: Admin